Understanding Data Wrangling
Part of my Python Data Analysis Learning Log

Introduction
Data wrangling is like preparing ingredients before cooking a meal. Imagine you have different types of vegetables, meat, and spices. Before you start cooking, you need to wash, chop, and organize everything neatly so that you can easily use them in your recipe.
Similarly, in data wrangling (cleaning or preproccessing), you deal with raw data collected from different sources like databases, spreadsheets, or websites. This data might be messy, with missing values, duplicates, or errors. Your job is to clean it up, organize it, and make it ready for analysis.
So, data wrangling involves tasks like removing irrelevant information, filling in missing values, correcting errors, and organizing data in a way that makes sense.
Identifying and Handling Missing Values
A missing value in a dataset can occur as "?", "NA", "0" or a blank cell. There are several solutions for missing data.
| Check with the data collection source | Replace the missing value | Leave it as missing data |
| Drop the variable | replace missing values by the average value of the entire variable | NA Values |
| Drop the data entry | replace by frequency of variable | |
| Drop the missing value | Be careful not to drastically impact the dataset that it skews the results |
dropna()method
It is important to drop NaN (Not a Number) objects in Pandas because they represent missing or undefined values in the data. NaN values can affect the accuracy and reliability of your data analysis.
The dropna() method in pandas is used to remove missing values (NaN, null values) from a DataFrame or Series object. It provides flexibility in terms of which axis (rows or columns) to consider for dropping, as well as the threshold for the number of missing values required to trigger dropping.
Axis specifies whether to drop rows (axis=0) or columns (axis=1) that contain missing values. By default, it's set to 0, meaning it drops rows.
Setting the argument inplace to True allows the modification to be done on the data set directly, inplace = True just writes the result back into the data frame.
# drop missing values along the column "x" as follows
df = df1.dropna(subset = ["x"], axis = 0, inplace = True)
replace() method
Pandas, a library in Python for handling data, includes a useful method called Replace. This method helps to fill in missing values (like NaNs) in your dataset with new values.
It can be replaced by a mean value. In Python, it can be calculated with the mean()method by the average of the entries within that specific column.
# new_value = df['column_name'].mean()
df.replace(missing_value,new_value)
Data Formatting
It is sometimes unavoidable that the data is written into different formats as it is collected from different places by different people.
This is where data formatting comes in. Data formatting is like putting all your information into a common language everyone can understand. It's a step in cleaning up your dataset where you make sure everything looks the same and makes sense. This consistency helps people compare and analyze the data without any confusion.
Incorrect Data Types
A wrong data type assigned to a feature. It is crucial during later stages of analysis to examine the data types of features and ensure they are converted to the appropriate types. Failure to do so could result in unexpected behavior of the developed models, potentially treating perfectly valid data as if it were missing.
# Identify the data type
df.dtypes()

# Convert the data type to integer in column'amount'
df.astype()
df['amount'] = df['amount'].astype("int")
Data Normalization
Data normalization is a way to make sure all the numbers in a dataset are in a similar range. It helps us compare different pieces of data more easily. We adjust the numbers so they're not too big or too small. This makes it simpler to understand and analyze the information.
This is an example of a normalized data.

Another sample showing normalization.


Methods of Normalizing Data

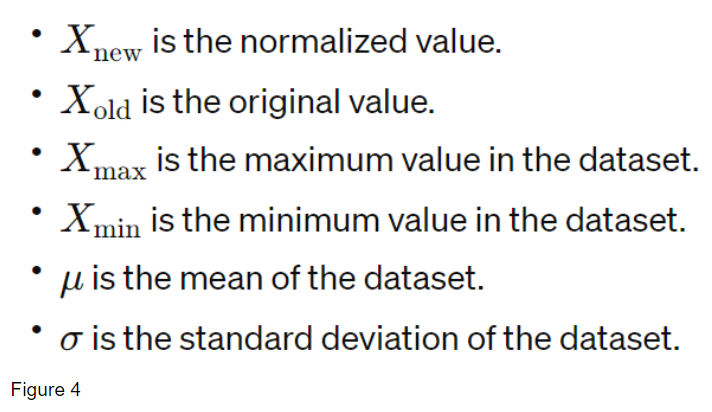
Simple Feature Scaling in Pandas
It brings data into a common stadard expression. From the Figure 1 Table, this can be done in one line of code using simple feature scaling in Pandas.

# Simple Feature Scaling in Pandas
df['length'] = df['length']/df['length'].max()
Min-Max in Pandas
From the Figure 1 Table, this can be done in one line of code using min-max in Pandas.

# min-max version 1 for the length column
df['Length_MinMax'] = (df['length'] - # df['length'].min()) / (df['length'].max() - df['length'].min())

# min-max version 2 for the length column
min_value = df['Length'].min()
max_value = df['Length'].max()
df['Length_MinMax'] = (df['Length'] - min_value) / (max_value - min_value)
Z-score in Pandas
From the Figure 1 Table, this can be done in one line of code using z-score in Pandas.

# Z-score
df['Length_ZScore'] = (df['length'] - df['length'].mean())/df['length'].std()
Data Binning
Binning means putting similar things together in groups. For instance, you might put ages into groups like 0-5 years old, 6-10 years old, and 11-15 years old. This can help us understand the data better. Sometimes, when we're trying to predict things with numbers, putting them into bins can make our predictions more accurate. This helps you see patterns and trends in your data more clearly.
Example of how binning looks like. Assuming we have the following data for car prices:

We want to bin these prices into three bins: Low, Medium, and High.
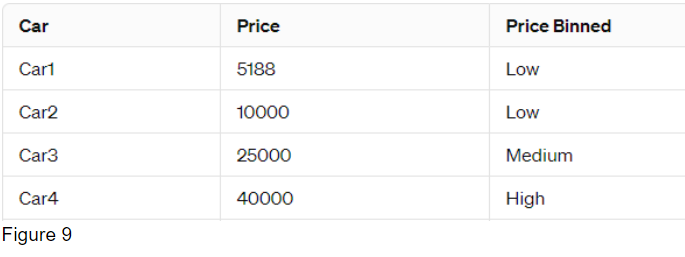
bins = np.linspace(min(df['price']),max(df['price']),4)
group_names = ['Low', 'Medium', 'High']
df['price_binned'] = pd.cut(df['price'], bins, labels = group_names, include_lowest = True)
Indicator Variables (Dummy Variables)
Turning Categorical Values to Numerical Values
The majority of statistical models are designed to process numerical inputs rather than objects or strings. Therefore, when training these models, only numerical data is accepted as input.

Here is an example problem. Suppose we have the following data for housing types: 1 bedroom apartment and 2 bedroom apartment. After applying one-hot encoding, where we create new features for each unique housing type:
One-hot encoding
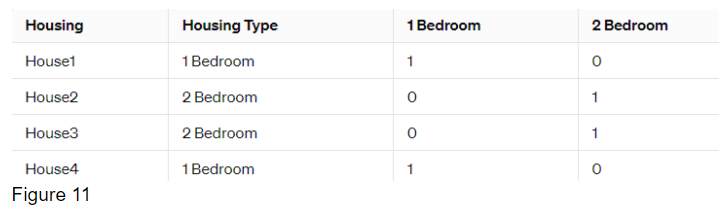
The solution can be using one-hot encoding. New columns/features for each unique housing type is created. It's done by adding dummy variables for each unnique feature. If a house belongs to a particular housing type, its corresponding feature is set to 1, while the other features are set to 0.
Dummy Variable Syntax in Pandas
Use pandas get.dummies() method to convert categorical (objects) variables to dummy variables.
pd.get_dummies(df['Housing_Type'])
Github Documentation to Data Wrangling Introduction
https://github.com/Akina-Aoki/Data-Science-Files/blob/main/Data%20Wrangling%20Introduction.ipynb
Disclosure
The content of this learning log is based on my personal reflections and insights gained from completing the IBM Data Analysis in Python course on Coursera. While I have engaged with the course materials and exercises, the views and interpretations presented here are entirely my own and may not necessarily reflect those of the course instructors or Coursera.


